Restaurant margins are notoriously thin, with the average profit margin hovering around just 3-5%. In this challenging environment, every efficiency gain and cost reduction becomes crucial for long-term success. While front-of-house operations often get attention for driving revenue, it's actually your kitchen performance that can make or break profitability.
The challenge is that kitchen operations generate massive amounts of data, but most restaurants struggle to turn that information into actionable insights. This is where Kitchen Display System (KDS) performance metrics become invaluable. By tracking the right KDS performance indicators, you can identify bottlenecks, reduce waste, improve customer satisfaction, and ultimately boost your bottom line.
In this post, we'll explore seven essential kitchen performance metrics that directly impact profitability. From speed of service to labor efficiency, these metrics provide the foundation for data-driven decision making that transforms kitchen operations from a cost center into a profit driver.
1. Speed of Service: On-Time Order Completion
Speed of service measures how many orders your kitchen completes within target timeframes. This might seem like a simple operational metric, but it's actually one of the most powerful predictors of long-term profitability.
Here's why this metric matters so much for your bottom line: customers who wait too long for their food are significantly more likely to leave negative reviews and less likely to return to your restaurant. Research shows that acquiring a new customer costs five times more than retaining an existing one, making customer retention critical for sustainable profitability.
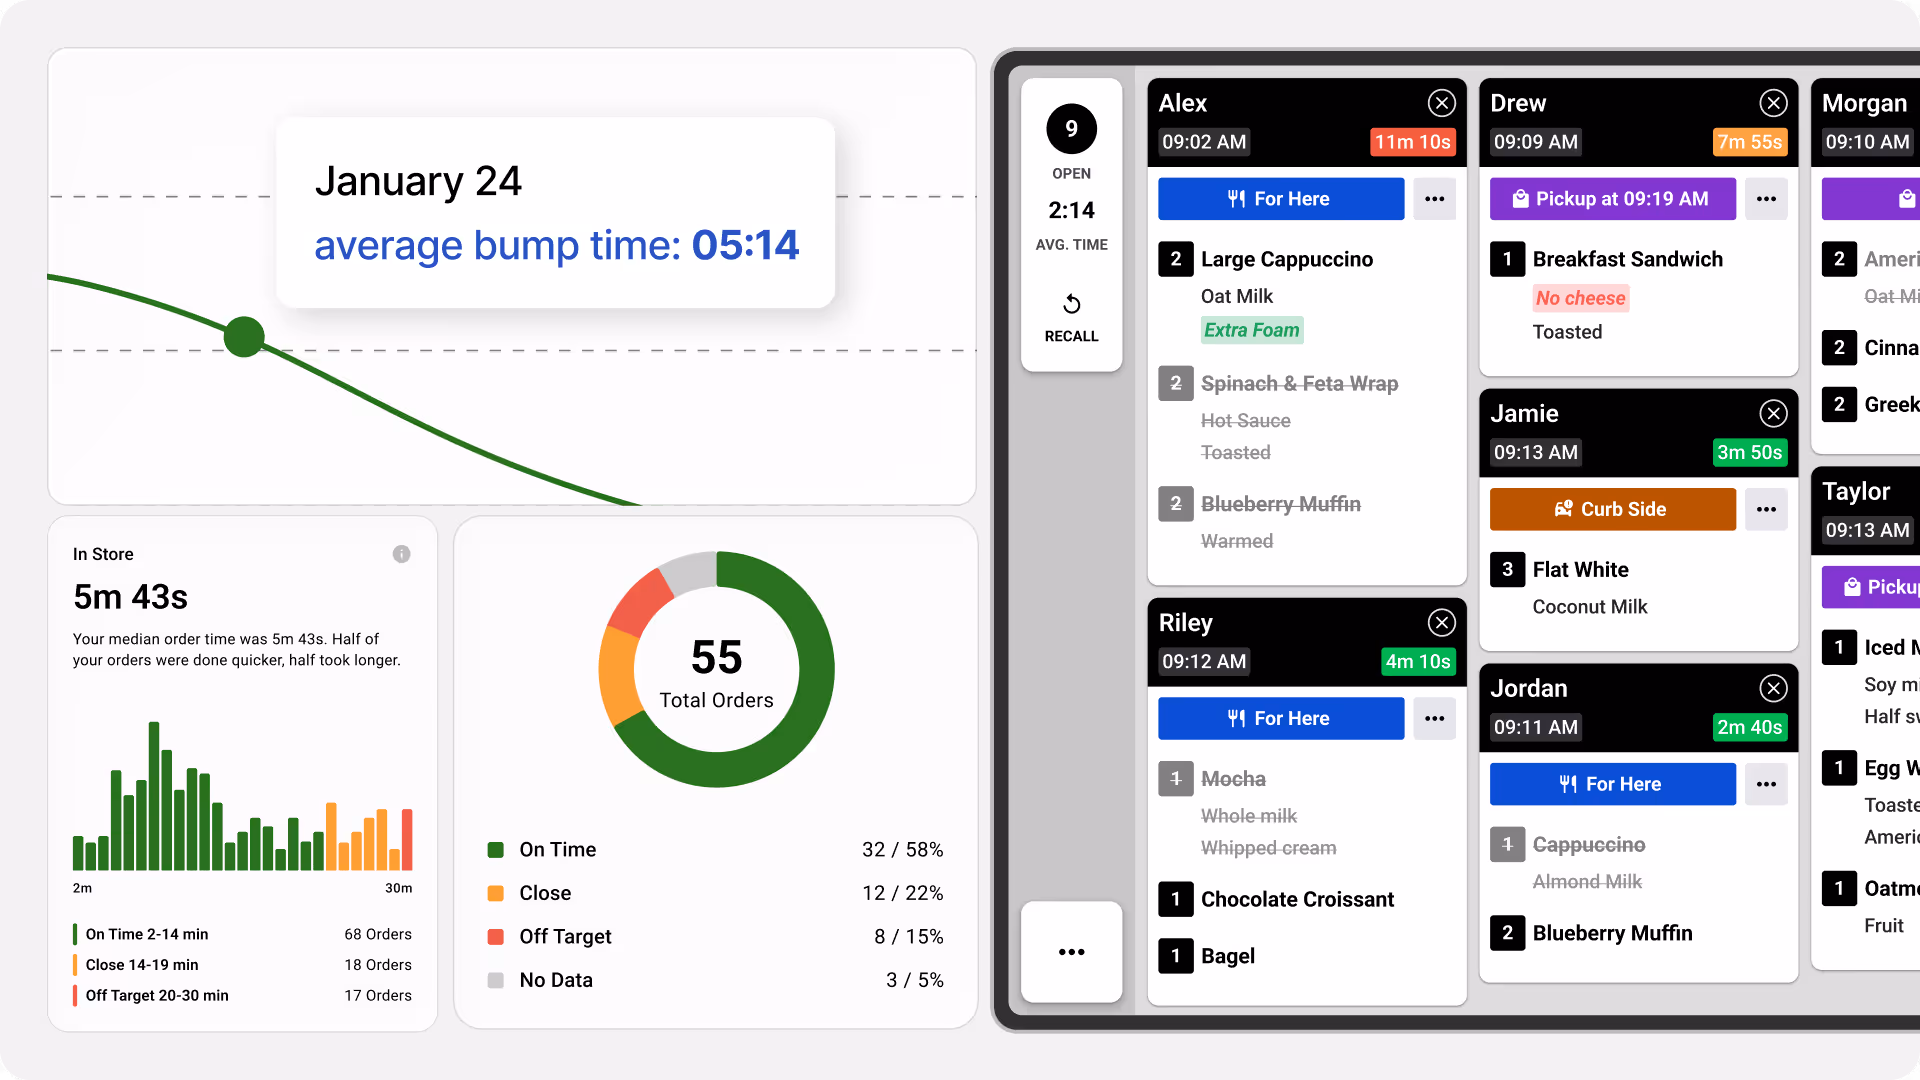
The key insight that many restaurants miss is that averages can be extremely misleading when measuring speed of service. Your average completion time might look acceptable, but what really matters is understanding how many customers are waiting too long for their food. If 80% of your orders are completed quickly but 20% take twice as long as expected, those unhappy customers will disproportionately impact your reputation and repeat business.
Different service types require different speed of service standards. Dine-in customers typically expect their meals within 15-20 minutes, while online order customers expect their orders to be ready when they arrive (regardless of how long that is from when they placed the order). Quick-service restaurants might target 3-5 minutes, while fine dining establishments might allow 25-30 minutes for complex entrees.
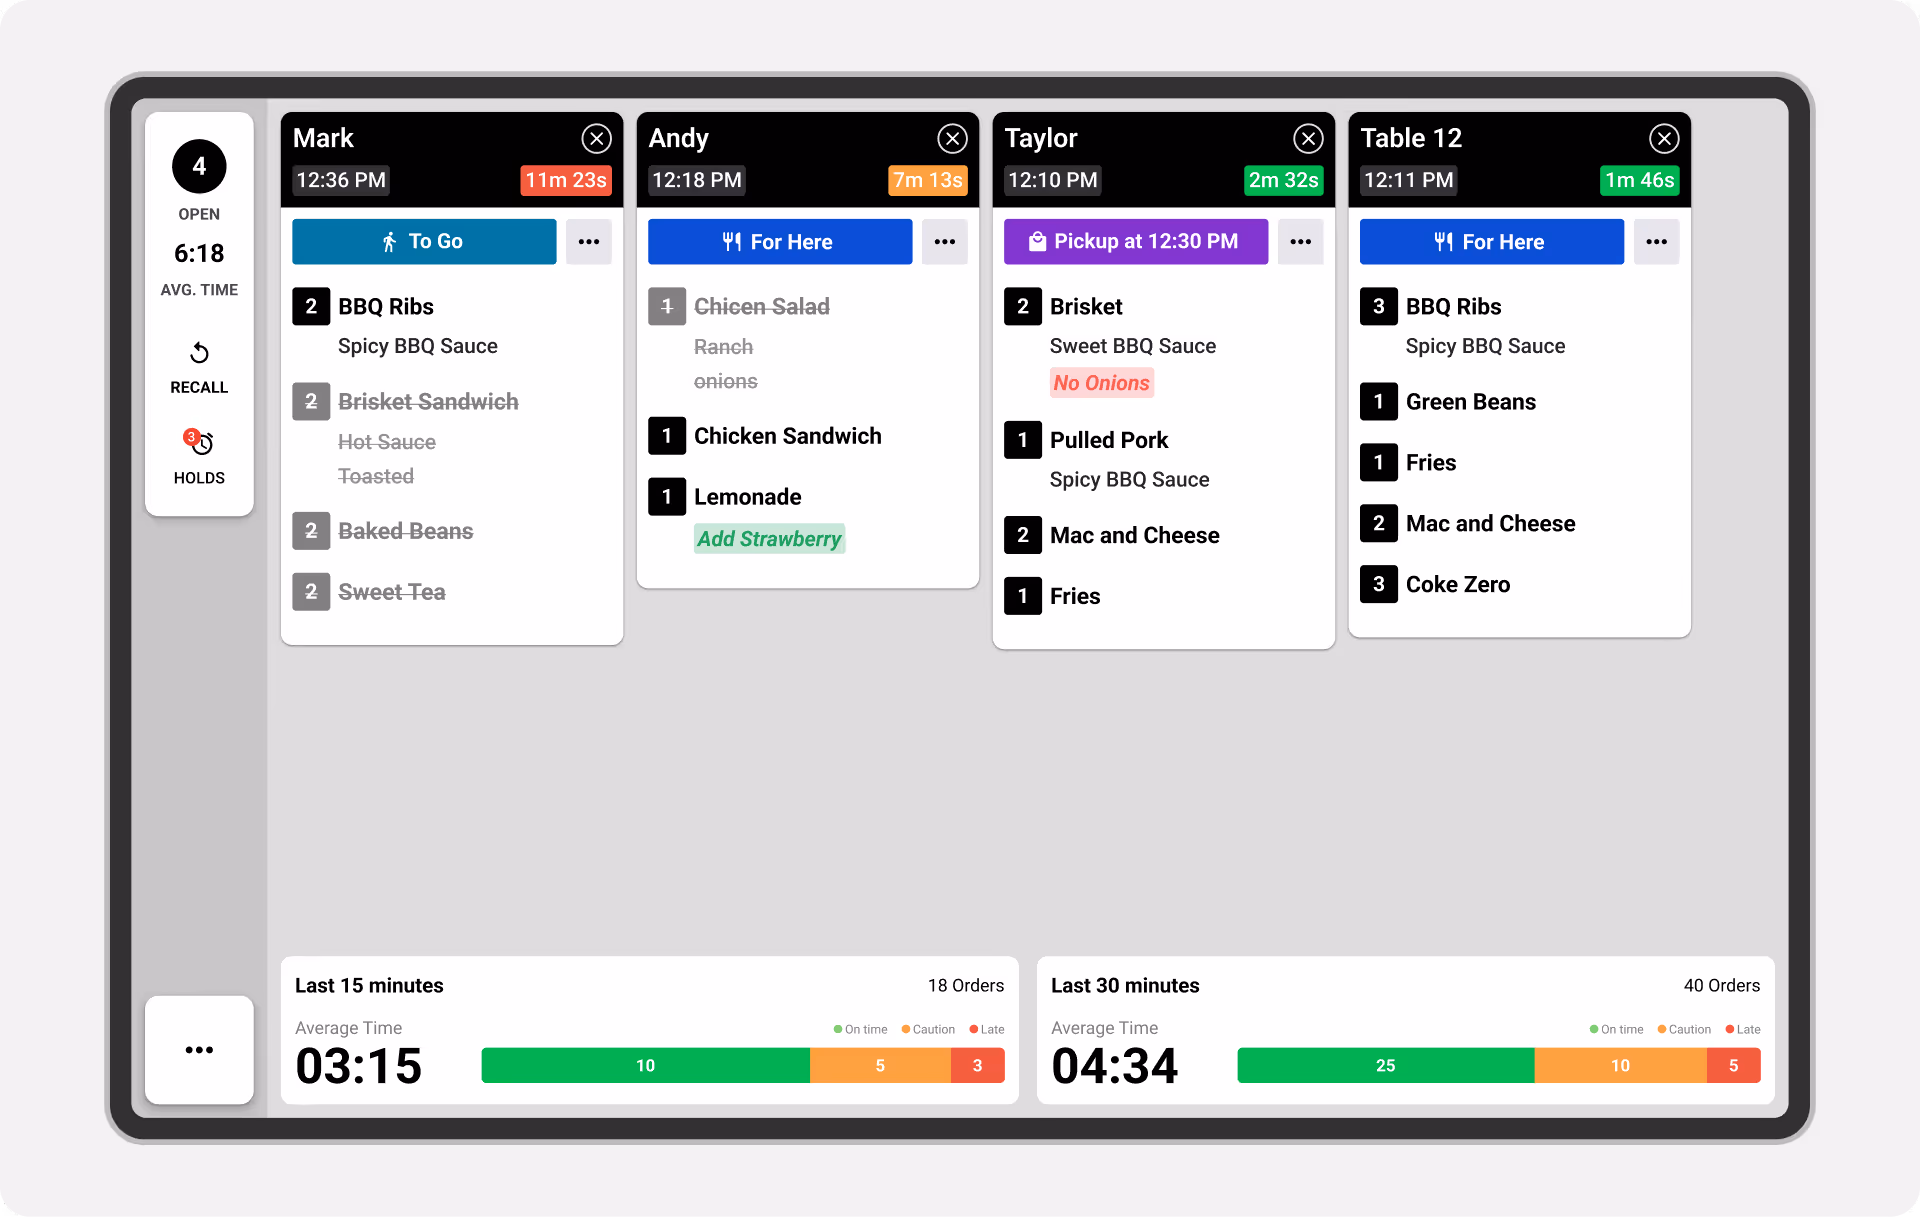
The most effective way to measure speed of service is by tracking the percentage of orders completed within your goal timeframes, broken down by service type and order complexity. Fresh KDS makes this easy by automatically tracking actual completion times against your customized goals and providing in-app alerts when orders are approaching target deadlines.
The long-term revenue impact of consistent speed of service cannot be overstated. Customers who consistently receive their orders on time have higher lifetime values, generate more positive word-of-mouth marketing, and are less likely to switch to competitors. Even a 10% improvement in on-time performance can translate to significant increases in customer retention and average order values over time.
2. Utilization Rate: Accurate KDS Usage
Utilization rate measures how accurately your kitchen staff uses the KDS system throughout service periods. While this might seem like a technical metric, it has direct implications for both food costs and operational efficiency.
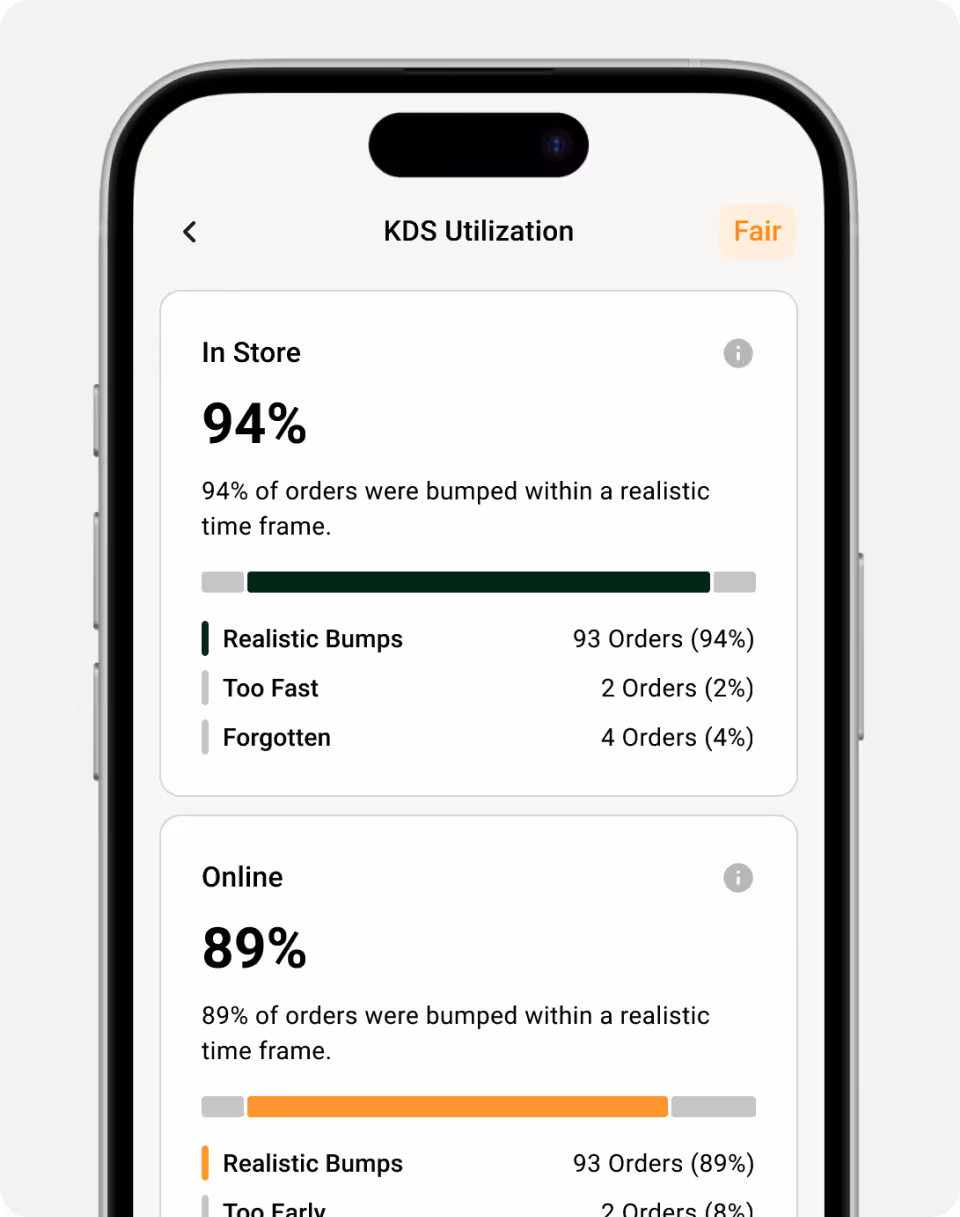
Poor KDS utilization typically manifests in two ways, both of which hurt profitability. First, kitchen staff might bump orders too quickly, before food is actually ready for pickup or delivery. This premature bumping increases the risk of order errors, leading to costly remakes, food waste, and dissatisfied customers. When orders are marked complete but aren't actually ready, it creates confusion between kitchen and service staff, often resulting in cold food being served or orders being prepared multiple times.
On the opposite end, some kitchen staff leave orders open on screens for hours after completion. This creates several problems: kitchen displays become cluttered with old orders, making it harder to spot new incoming orders; actual preparation times become impossible to track accurately; and kitchen staff lose visibility into current order priorities and timing.
Proper utilization rate is typically measured as the percentage of orders bumped within a realistic time range. Most successful restaurants target utilization rates above 90%.
The profitability impact becomes clear when you consider the costs associated with poor utilization. Each remake due to premature bumping costs an average of 2-3 times the original food cost when you factor in wasted ingredients, additional labor time, and potential comping of incorrect orders. Meanwhile, orders left open too long create operational inefficiencies that reduce overall kitchen throughput during peak periods.
Fresh KDS addresses utilization challenges through real-time monitoring and automated alerts. The system can identify patterns of premature bumping or extended open times, enabling managers to provide targeted training and workflow improvements.
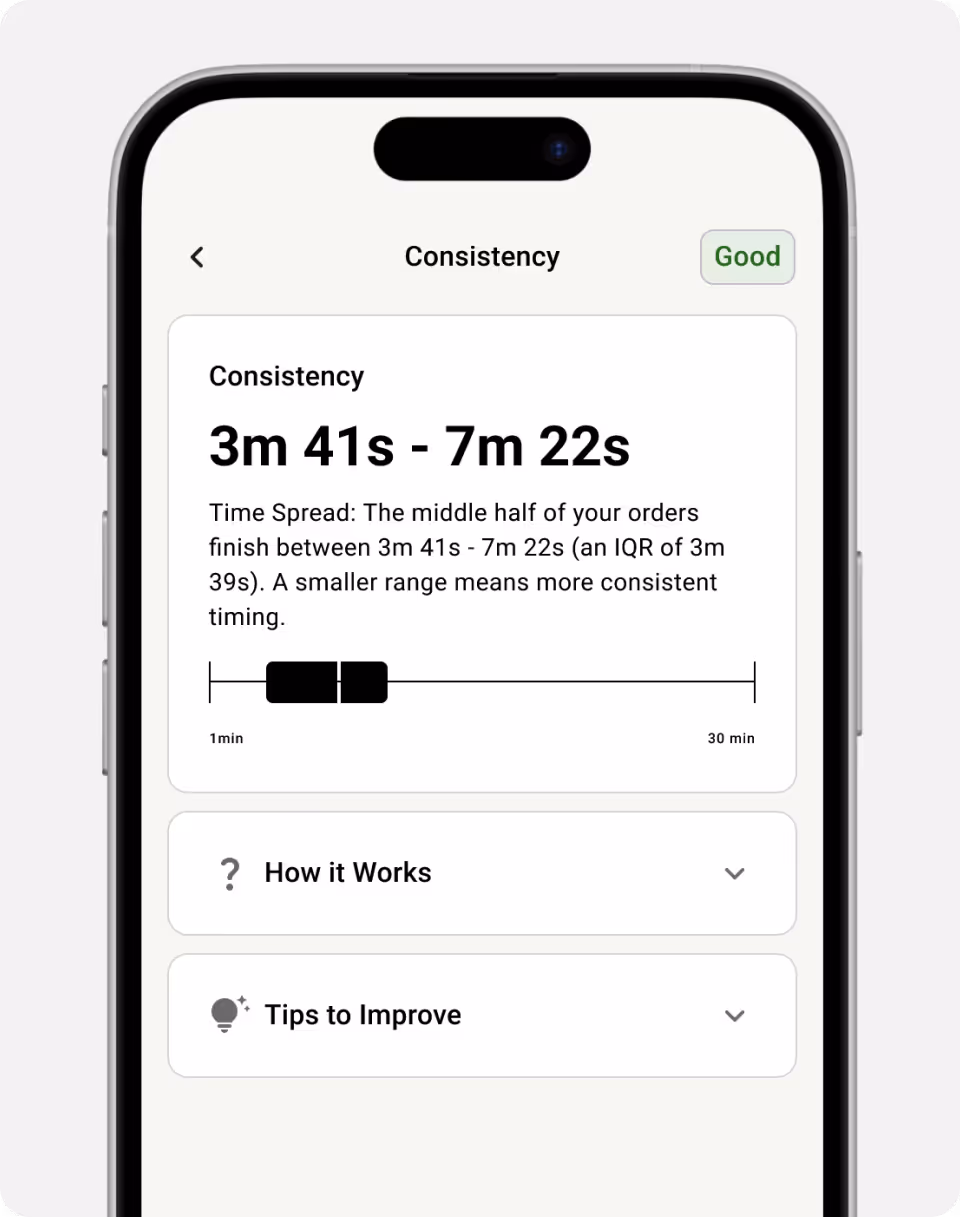
3. Kitchen Consistency: Reliable Service Times
Kitchen consistency measures how predictable your service times are, typically calculated as the standard deviation or coefficient of variation in order completion times. While speed matters, consistency often matters even more for building customer loyalty and operational predictability.
From a customer psychology perspective, predictability builds trust and loyalty. Customers want to know what to expect when they visit your restaurant. A coffee shop that sometimes delivers orders in 3 minutes and sometimes takes 15 minutes creates uncertainty that makes customers less likely to return, especially during time-sensitive situations like morning commutes or lunch breaks.
The profitability impact of consistency extends beyond customer satisfaction. Predictable kitchen performance enables better staffing decisions, more accurate labor cost planning, and improved inventory management. When you can reliably predict how long different types of orders will take, you can optimize staffing levels to match demand patterns more precisely.
Consistency is typically measured using the coefficient of variation, which expresses standard deviation as a percentage of the mean completion time. High-performing restaurants typically maintain coefficients of variation below 30% for similar order types during comparable service periods. For example, if your average sandwich takes 8 minutes to prepare, a consistent operation would complete 80% of similar sandwiches between 6-10 minutes.
Operational benefits of improved consistency include more effective labor scheduling, better customer communication about wait times, and reduced stress on kitchen staff. When service times are predictable, front-of-house staff can set accurate expectations with customers, reducing complaints and improving overall satisfaction scores.
Inconsistent performance often indicates underlying operational issues such as inadequate staff training, equipment problems, or poorly designed workflows. By tracking consistency metrics over time, restaurants can identify specific periods or order types that show high variability and address root causes systematically.
4. Order Accuracy Rate: Getting It Right the First Time
Order accuracy rate measures the percentage of orders completed correctly without requiring remakes, modifications, or customer complaints. This metric has one of the most direct impacts on profitability because every order error represents multiple cost categories simultaneously.
The direct cost impact of poor accuracy is substantial. Each incorrect order typically costs around $30 when you account for wasted ingredients, additional labor time for remakes, potential comped meals, and lost productivity during busy periods. For a restaurant with average check sizes of $15, each remake effectively costs $30-60 in total impact when indirect costs are included.
Beyond immediate costs, accuracy problems damage customer retention and lifetime value. Customers who receive incorrect orders are significantly less likely to return, and they're more likely to share negative experiences through online reviews and word-of-mouth. In today's connected world, a single order accuracy problem can influence dozens of potential customers.
Modern kitchen display systems play a crucial role in improving accuracy by providing clear, detailed order displays that reduce miscommunication between front-of-house and kitchen staff. Digital displays eliminate handwriting interpretation issues, automatically organize orders by preparation time and complexity, and can highlight special instructions or modifications that might otherwise be overlooked.
Measuring accuracy requires tracking multiple data points including remake requests, customer complaints, returned food, and staff reports of preparation errors. The most comprehensive approach involves correlating POS data with KDS completion times to identify patterns in accuracy problems across different menu items, time periods, and staff members.
High-performing restaurants typically maintain accuracy rates above 95%, meaning fewer than 5% of orders require any kind of correction or remake. Achieving this level of accuracy requires systematic approaches including staff training, clear communication protocols, and regular review of error patterns to identify improvement opportunities.
The ROI of accuracy improvements is typically immediate and substantial. Restaurants that improve accuracy rates by just 3-5 percentage points often see food cost reductions of 1-2% within the first quarter, representing thousands of dollars in annual savings for most operations.
5. Kitchen Throughput: Orders Per Hour
Kitchen throughput measures the total number of orders your kitchen can process per hour during different service periods. This metric directly impacts revenue potential because higher throughput capacity means you can serve more customers during peak periods without compromising quality or service times.
Revenue maximization depends heavily on your ability to handle demand during peak hours. If your kitchen can only process 40 orders per hour but demand peaks at 60 orders per hour, you're losing potential revenue every day during lunch and dinner rushes. This lost capacity represents some of the highest-value revenue since peak period customers typically have higher average order values and lower marketing acquisition costs.
Throughput analysis helps identify specific bottlenecks that limit capacity. Common constraints include prep station organization, equipment limitations, staff coordination issues, and menu complexity factors. By measuring throughput at different capacity levels, you can pinpoint exactly where workflow breaks down and prioritize improvement investments.
Labor efficiency optimization becomes possible when you understand throughput patterns. Revenue per labor hour is a key profitability metric, and higher throughput directly improves this ratio. Additionally, understanding your maximum sustainable throughput helps with strategic decisions about staffing levels, equipment investments, and menu engineering.
Peak hour performance requires special attention because these periods often generate 60% of daily revenue despite representing only 4-6 hours of operating time. Small improvements in peak period throughput can have outsized impacts on overall profitability. Restaurants that increase peak hour throughput by even 10-15% often see corresponding increases in daily revenue.
Scalability insights from throughput analysis inform growth planning and expansion decisions. Understanding your current capacity limits helps determine when additional equipment, staff, or space investments become necessary to support business growth. This data-driven approach to expansion planning reduces risk and improves ROI on capital investments.
Modern KDS systems provide real-time throughput monitoring, enabling managers to make immediate adjustments during service. When throughput drops below targets, alerts can trigger additional staff deployment, workflow modifications, or menu complexity adjustments to maintain optimal performance.
6. Order Queue Management: Minimizing Wait Times
Order queue management focuses on average and maximum queue lengths throughout different service periods. While related to throughput, queue management specifically addresses the customer experience impact of order backlogs and the revenue consequences of excessive wait times.
Long queues directly drive potential customers away before they even place orders. Studies show that the majority of customers abandon a queue if they have to wait more than four minutes. Each customer who leaves represents immediate revenue loss plus the opportunity cost of future visits and referrals.
The relationship between queue length and sales volume is often non-linear. Small increases in queue length can disproportionately impact customer behavior, especially during lunch rushes when customers have limited time. Queue management becomes crucial for maximizing revenue during high-demand periods.
Staff stress and performance suffer when queues become overwhelming. Kitchen staff working under extreme pressure make more mistakes, work less efficiently, and experience higher turnover rates. The psychological impact of constantly falling behind creates negative feedback loops that further degrade performance.
Effective queue management requires understanding the relationship between order complexity, kitchen capacity, and customer arrival patterns. Simple orders might move through queues quickly, but complex orders can create bottlenecks that affect overall flow. Menu engineering decisions should consider queue impact, not just food costs and margins.
KDS systems enable sophisticated queue optimization through intelligent order sorting, priority management, and automated load balancing. Orders can be distributed across prep stations based on capacity and complexity, while time-sensitive orders receive appropriate priority without disrupting overall flow.
Real-time queue monitoring allows for proactive management decisions. When queues reach predetermined thresholds, managers can deploy additional staff, temporarily simplify menu options, or communicate realistic wait times to customers to manage expectations and reduce abandonment.
7. Labor Cost Per Order: Operational Efficiency
Labor cost per order divides total kitchen labor costs by the number of orders completed during specific periods. This metric provides direct insight into operational efficiency and represents one of the most actionable profitability indicators available to restaurant managers.
As a direct profitability metric, labor cost per order immediately reveals the efficiency of kitchen operations. Since labor typically represents 25-35% of total restaurant costs, even small improvements in labor efficiency can significantly impact overall profitability. Reducing labor cost per order by just $0.50 can translate to thousands of dollars in annual savings.
Efficiency tracking across different periods reveals patterns in productivity and helps identify opportunities for improvement. Morning prep periods, lunch rushes, dinner service, and closing procedures all have different efficiency characteristics. Understanding these patterns enables more precise staffing decisions and workflow optimizations.
Staffing optimization becomes data-driven when you track labor costs per order. Instead of using rule-of-thumb approaches to scheduling, you can identify exactly how many staff members are needed to maintain target efficiency levels during different demand periods. This precision reduces both understaffing problems and labor cost overruns.
The ROI of KDS investments becomes measurable through labor cost per order improvements. Modern kitchen display systems typically reduce labor needs through improved communication, automated timing, and streamlined workflows. Restaurants often see 10-20% improvements in labor efficiency within 3-6 months of KDS implementation.
Benchmarking against industry standards provides context for performance evaluation. Quick service restaurants typically target labor costs of $1.50-3.00 per order, while casual dining operations might target $3.00-6.00 per order depending on complexity and service style. Understanding where your operation stands relative to comparable businesses helps set realistic improvement goals.
Performance tracking should include both absolute costs and trend analysis. Labor cost per order naturally fluctuates based on order complexity, seasonality, and demand patterns. The key is identifying trends that indicate improving or declining efficiency over time and correlating these trends with specific operational changes or challenges.
Putting It All Together: Your Action Plan
Successfully implementing KDS performance tracking requires a systematic approach that builds momentum through early wins while establishing long-term habits for continuous improvement.
Start by establishing baseline measurements for all seven metrics over a 2-4 week period. This baseline provides the foundation for setting realistic improvement targets and measuring progress over time. Avoid the temptation to make operational changes during the baseline period; focus solely on understanding your current performance levels.
Prioritize metrics based on your biggest operational challenges and profit improvement opportunities. If customer complaints about wait times are frequent, focus first on speed of service and consistency. If food costs are above target, emphasize accuracy rates and utilization. If labor costs are problematic, concentrate on throughput and labor cost per order.
Set realistic improvement targets that build confidence and momentum. Attempting to improve all metrics simultaneously often leads to confusion and inconsistent execution. Instead, focus on 2-3 metrics initially and aim for modest improvements of 10-20% rather than dramatic changes that might disrupt operations.
Regular review cycles create accountability and maintain focus on continuous improvement. Weekly reviews should focus on immediate performance issues and short-term adjustments, while monthly reviews analyze trends and evaluate the effectiveness of operational changes. Quarterly reviews provide opportunities for broader strategic adjustments and goal setting.
Staff engagement is crucial for sustained success. Share performance metrics with kitchen teams, celebrate improvements, and involve staff in identifying improvement opportunities. When kitchen staff understand how their individual actions impact overall performance, they become partners in optimization rather than passive participants.
Continuous optimization requires viewing KDS performance metrics as dynamic tools rather than static reports. As operations improve and customer expectations evolve, metric targets and measurement approaches should adapt accordingly. The goal is creating a culture of data-driven decision making that continuously seeks better ways to serve customers while improving profitability.

Conclusion
These seven KDS performance metrics provide a comprehensive framework for understanding and optimizing kitchen operations that directly impact restaurant profitability. From speed of service that drives customer satisfaction to labor efficiency that controls costs, each metric offers specific insights that translate into actionable improvements.
The key insight is that small, consistent improvements across multiple performance areas compound into significant profitability gains over time. A restaurant that improves speed of service by 15%, reduces remake rates by 20%, and increases throughput by 10% might see overall profit margins improve by 2-3 percentage points, representing substantial increases in annual profitability.
Fresh KDS makes tracking and optimizing these metrics straightforward through automated data collection, real-time monitoring, and actionable reporting. Rather than spending hours manually calculating performance indicators, managers can focus their time on implementing improvements and coaching staff toward better performance.
The future belongs to restaurants that embrace data-driven operations and use performance metrics to create sustainable competitive advantages. By implementing systematic tracking of KDS performance metrics, restaurants can transform their kitchens from cost centers into profit drivers that consistently deliver exceptional customer experiences while maximizing operational efficiency.
Ready to try Fresh KDS in your restaurant?


.png)


.webp)


