Fraud Blocker
All Blogs
Restaurant Tips

Why average ticket time is the wrong number

Average ticket time hides slow orders. See why speed of service should be measured by on-time performance, not the mean, to protect repeat visits.

ABOUT THIS RESTAURANT

Service Type

Locations:

Location

POS Used

See how Fresh KDS can impact your kitchen efficiency today.
Get started
Simplify your kitchen operations with Fresh KDS.
Get started — it's free

When you measure a kitchen by average ticket time, the guests who had the worst experience disappear into the average. The average can look healthy on a night when plenty of guests waited far too long. It smooths the worst moments of service into a calm figure on a report, and the guest who stood at the counter for twenty minutes disappears into it.

That's the problem with an average. It answers the wrong question.

What the average actually measures

Average ticket time tells you, roughly, how long a typical order took across some window of service. It's easy to calculate and easy to put on a report, which is likely why it stuck around. But a typical order is not what makes a guest decide whether to come back. Their order and experience is the reason for the return.

The number that looked fine was built by burying those tables.

The guests the average forgets

We think the more useful question is simple: how many guests had a bad experience tonight, and why?

That's a different lens. Instead of collapsing service into one figure, it counts the orders that missed their mark and the guests attached to them. One late order is one guest who waited. Ten late orders is ten guests, some of whom will quietly decide the wait was not worth it. None of that shows up when you only watch the mean.
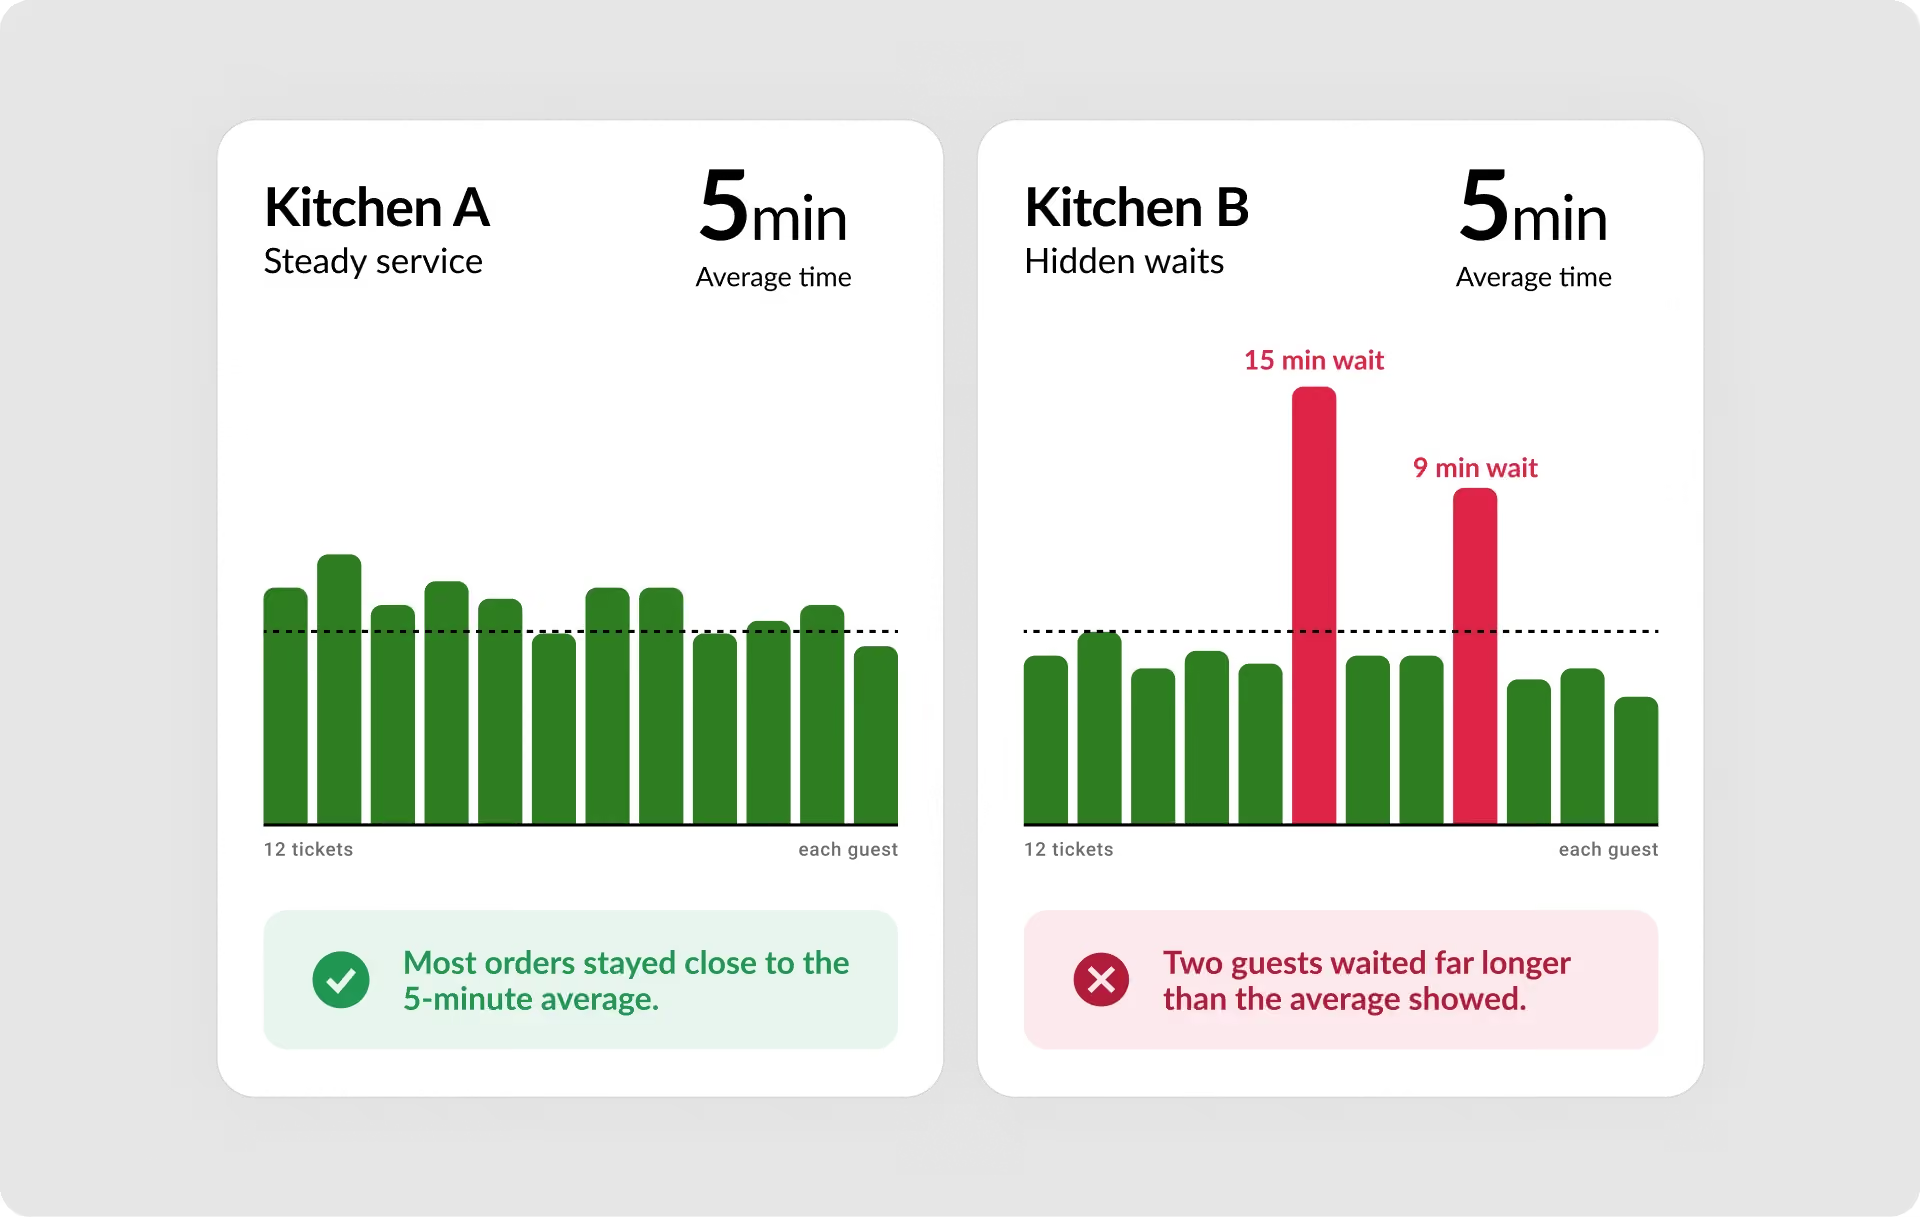
This is what we refer to as affected guests. It reframes performance around the people who were let down because their orders took too long, rather than the bulk who received their orders on time. A kitchen can hold a strong average and still send a steady trickle of guests home unhappy. The average will never tell you it's happening as it occurs.

What this costs you

Restaurants live on repeat visits, and repeat visits depend heavily on whether a guest's order was ready when they expected it. The guests buried inside a good average are often the ones least likely to return, and they rarely complain on the way out. They just do not come back. A metric that hides them also hides the slow leak in your repeat business, which is an expensive thing not to be able to see.

Speed is not the same as on time

There is a second trap hiding inside ticket time: the assumption that faster is always the goal. For a lot of orders, it's not. A pickup order that finished ten minutes early sits and goes cold before the guest arrives. A dine-in entree rushed ahead of the rest of the table's orders breaks the meal rhythm. Speed of service isn't just about being quick — it's about being ready when the guest expects it.

An average ticket time cannot see that. It treats early and late as if the size of the gap is all that matters. What really matters is whether each order met the expectation attached to it.
Serve every order on time

What to look at instead

The fix is not a better average. It's measuring at the level where service actually succeeds or fails: the individual order, and the individual item.

  • How many orders missed their target time, and how far off were they? That is your affected-guests picture, and it points straight at the guests who need attention.
  • Where in the kitchen did the time go? An order isn't a single event. Items wait in a station queue, take time to prep, and sit at the pass. Looking at item prep time, station queue delay, and how far apart the items in one order finished tells you where service slipped.
  • Which locations, channels, shifts, or stations are slipping? Performance is rarely uniform. The same brand can run on time at one location and fall behind at another, and an average across both hides the one that needs help.

None of this requires guessing. It requires capturing what happens at the point of production, on the kitchen screen, where the order is actually made. That's the record most restaurant systems never collect, because the POS, labor, and guest tools all sit around the kitchen rather than inside it.

The takeaway

Average ticket times aren't useless. They're just blunt. They answer how a typical order did. But the questions that matter most for protecting your repeat business are how many guests didn't get what they expected, and where it went wrong.

Measure the orders, not the mean, and the guests the average was hiding come back into view. That's the first step toward keeping more of them on time.

Fresh KDS captures kitchen execution at the point of production and helps operators see on-time performance by order, item, location, channel, shift, and station.

See how it works.

July 8, 2026

Why average ticket time is the wrong number

When you measure a kitchen by average ticket time, the guests who had the worst experience disappear into the average. The average can look healthy on a night when plenty of guests waited far too long. It smooths the worst moments of service into a calm figure on a report, and the guest who stood at the counter for twenty minutes disappears into it.

That's the problem with an average. It answers the wrong question.

What the average actually measures

Average ticket time tells you, roughly, how long a typical order took across some window of service. It's easy to calculate and easy to put on a report, which is likely why it stuck around. But a typical order is not what makes a guest decide whether to come back. Their order and experience is the reason for the return.

The number that looked fine was built by burying those tables.

The guests the average forgets

We think the more useful question is simple: how many guests had a bad experience tonight, and why?

That's a different lens. Instead of collapsing service into one figure, it counts the orders that missed their mark and the guests attached to them. One late order is one guest who waited. Ten late orders is ten guests, some of whom will quietly decide the wait was not worth it. None of that shows up when you only watch the mean.

This is what we refer to as affected guests. It reframes performance around the people who were let down because their orders took too long, rather than the bulk who received their orders on time. A kitchen can hold a strong average and still send a steady trickle of guests home unhappy. The average will never tell you it's happening as it occurs.

What this costs you

Restaurants live on repeat visits, and repeat visits depend heavily on whether a guest's order was ready when they expected it. The guests buried inside a good average are often the ones least likely to return, and they rarely complain on the way out. They just do not come back. A metric that hides them also hides the slow leak in your repeat business, which is an expensive thing not to be able to see.

Speed is not the same as on time

There is a second trap hiding inside ticket time: the assumption that faster is always the goal. For a lot of orders, it's not. A pickup order that finished ten minutes early sits and goes cold before the guest arrives. A dine-in entree rushed ahead of the rest of the table's orders breaks the meal rhythm. Speed of service isn't just about being quick — it's about being ready when the guest expects it.

An average ticket time cannot see that. It treats early and late as if the size of the gap is all that matters. What really matters is whether each order met the expectation attached to it.

Serve every order on time

What to look at instead

The fix is not a better average. It's measuring at the level where service actually succeeds or fails: the individual order, and the individual item.

  • How many orders missed their target time, and how far off were they? That is your affected-guests picture, and it points straight at the guests who need attention.
  • Where in the kitchen did the time go? An order isn't a single event. Items wait in a station queue, take time to prep, and sit at the pass. Looking at item prep time, station queue delay, and how far apart the items in one order finished tells you where service slipped.
  • Which locations, channels, shifts, or stations are slipping? Performance is rarely uniform. The same brand can run on time at one location and fall behind at another, and an average across both hides the one that needs help.

None of this requires guessing. It requires capturing what happens at the point of production, on the kitchen screen, where the order is actually made. That's the record most restaurant systems never collect, because the POS, labor, and guest tools all sit around the kitchen rather than inside it.

The takeaway

Average ticket times aren't useless. They're just blunt. They answer how a typical order did. But the questions that matter most for protecting your repeat business are how many guests didn't get what they expected, and where it went wrong.

Measure the orders, not the mean, and the guests the average was hiding come back into view. That's the first step toward keeping more of them on time.

Fresh KDS captures kitchen execution at the point of production and helps operators see on-time performance by order, item, location, channel, shift, and station.

See how it works.

Switch to Fresh KDS with confidence

Follow this step-by-step guide for a quick and stress-free switch from Square KDS to Fresh KDS.

Why Speed of Service Matters

See why speed and consistency are key to restaurant success, improving guest satisfaction, revenue, and efficiency.

Get started for free.

Begin your Fresh KDS 7-day trial today by setting up your account. The process is completely free, and only takes a few minutes. No credit card is needed, and you can cancel anytime.

Get started - it's free
Boosting kitchen EFFICIENCY at